Machine learning at high redshift
Learn more about using machine learning techniques to classify and determine the distance to newly detected radio sources.
Whether the absorption is associated or intervening is crucial to understanding the numbers of active and quiescent galaxies in the distant Universe, respectively. Determining this traditionally requires a follow-up optical spectrum, which is observationally expensive (or prohibitive for the huge number of new sources which will detected with the Square Kilometre Array, SKA). Furthermore, the most gas rich objects are also the faintest in visible light, although readily detectable in the radio band.
We therefore require a novel technique of classifying the nature of the absorption in the absence of an optical spectrum. Machine learning techniques, which use the spectral properties as features, show considerable promise, although the numbers are still very small.
The SKA is expected to detect 100 of millions new radio sources, but without optical spectra, we have no idea how far away these are (the spectroscopic redshift). Our ultimate aim is to use the features of the continuum emission of the quasar to determine its redshift. However, this requires a large compilation of well sampled radio spectral energy distributions.
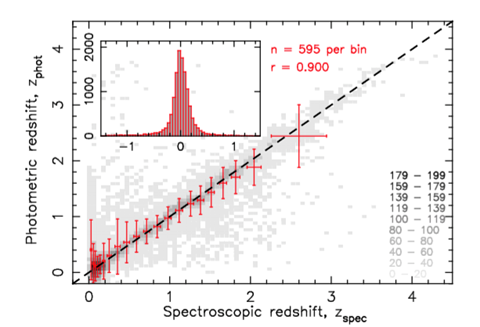
In the meantime, we have had considerable success in using machine learning to estimate the redshifts from the optical photometry (how bright the source is in different UV-optical-IR bands). Whereas the holy grail remains using the radio properties alone, an object’s photometry can be collected in the fraction of the time required for a useful spectrum. Thus, this method is of some use in the prediction of redshifts of objects which are faint in the optical band.